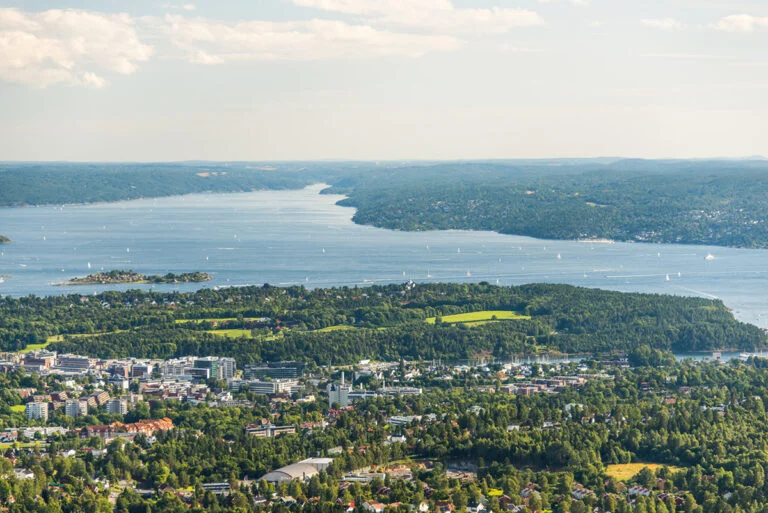
Check out these statistics from Oslo that paint a picture of what life is like in Norway’s capital city.
So many people around the world are fascinated by Scandinavia, or at least the idea of Scandinavia. But what is life in a Scandinavian city really like, especially Oslo, the capital city of Norway?

One way to help understand a city is to look into the numbers. Of course, facts and figures can never tell the whole story, but they do help to put a city in perspective with others around the world.
We’ve previously looked at some Norway stats, which proved very popular. This time, we dive into the details of Norway’s capital city, Oslo. From population figures to waste and recycling, these numbers wil shed light on Oslo.
Where do these numbers come from? In most cases, they are from Statistics Norway (SSB), the official producer of national statistics, and Oslo municipality.
Table of Contents
Population of Oslo
Oslo municipality’s population is 720,568 as of Q2, 2024. That’s an increase of more than 23,000 in the last four years. It’s also approximately 13% of Norway’s population.
Where does this increase come from? In 2023, there were 8,561 births compared with 4,020 deaths in Oslo municipality. There was also net migration of 4,218.
But the wider Oslo urban area stretches well beyond the municipality limits into parts of Akershus county. The total urban area tops one million people, and is often referred to as the ‘Oslo region’.
The population of Oslo is projected to reach 748,000 by 2030, and 817,000 by 2050.
Oslo Immigration Stats
14% of Norway’s population are immigrants, which rises to 17.3% if we include Norwegian-born to immigrant parents.
But that’s a national average, and the numbers in Oslo are much higher. Approximately 33% of Oslo’s population are immigrants or Norwegian-born to immigrant parents.

Oslo has seen significant changes in the size and composition of immigrants in recent decades, most notably after EEA enlargements.
The districts Stovner, Søndre Nordstrand, Alna and Grorud have the highest percentage of people with an immigrant background, each with over 50%. Read more about the districts of Oslo here.
Of Oslo’s population with an immigrant background, the biggest numbers are from Pakistan, Somalia, Poland, Sweden and Iraq. Making up the top ten are Eritrea, Syria, Ukraine, Germany, and Lithuania.
Oslo Travel Stats
Travel statistics tell an interesting story as to which cities and places are trending. Of course, the events of 2020 have caused chaos in the travel industry.
Before then, Oslo's growth as a travel destination was doing very well indeed. In this section, we'll focus on statistics from Innovation Norway's 2019 tourism report, published in early 2020.
The report shows that Oslo lies in second place behind the fjord region in terms of foreign visitors. 53% visited the Norwegian fjords, while 52% spent time in the Oslo region.
The numbers are lower for domestic tourists, but the fjords and Oslo still come first and second. For Norwegians, 25% visit the fjords with 21% choosing the capital city region.
In the Oslo region, the largest percentage of international tourists come from Sweden and Denmark (14% combined), followed by Germany (11%), the USA (10%), France (6%) and the Netherlands (5%). Of the remaining visitors, more than half come from other European countries.
A 2023 survey of Oslo’s residents found the following:
- 3 out of 4 residents in Oslo experience no issues with tourism
- 82% believe that Oslo should continue marketing itself to attract more visitors
- Over 70% of Oslo residents are proud and welcoming when friends and family, both domestic and international, visit
Land Use in Oslo
Downtown Oslo sits at the end of the Oslofjord. From here, the city stretches out along both sides of the fjord and inland towards the north-east. The forested hills to the north and east give the city a feeling of an amphitheatre.

Of Oslo's total area, 130km2 (50 square miles) is built-up and 7km2 (2.7 square miles) is agricultural. Within the built up zone, open areas account for 22km2 (8.5 square miles).
Climate Stats in Oslo
Oslo’s climate classification is a humid continental climate, meaning warm summers and cold winters. However, winters are less cold than other continental areas at the same latitude due to oceanic influences.
So, what can you expect from the weather in Oslo? Well, the record temperature recorded at Oslo’s Blindern weather station is 35C/95F. The record low is -26C/-14.8F.
On average, the city receives some rainfall on 114 days of the year. Total average annual rainfall is 802.7mm/31.6in.
The warmest month is typically July, with an average mean temperature of 17.7C/63.9F. The coldest month is typically January, with an average mean temperature of -2.9C/26.8F.
In a typical year, the average temperature is below freezing in December, January and February.
Waste and Recycling Stats in Oslo
Despite increased consumption and general economic growth, household waste has decreased in recent years.
Total Residual Waste (kilos per inhabitant for energy recovery and landfill) decreased from 162.5 kg in 2022 to 156.6 kg in 2023, below the target of 170 kilos, marking a positive trend.
The share of household waste for material recycling showed a slight drop from 42% in 2022 to 41% in 2023, missing the target of 42%. Nevertheless, it’s still an increase of about 15% from 2004.

There has been a consistent decline in food waste, from 27.2 kg in 2019 to 21.6 kg in 2023. The amont of unsorted plastics has fluctuated slightly but generally decreasing. It was 3.8 kg in 2019, dropped to 3.5 kg in 2020, and ended at 3.6 kg in 2023.
The city also utilised waste-to-energy plants to recover energy from household waste. In 2018, 57% of household waste was sent to these plants, generating enough electricity to power all city schools.
The excess heat produced by the process is added to the city’s district heating network.
Air Quality in Oslo
Air quality has improved in Oslo over the past decades despite an increase in population. This is mostly due to the introduction of fees for studded tires, environmental speed limits and measures to prevent road dust.
In 2016, laws on the limits for airborne particulate matter were made stricter. As a result, Oslo’s city council set ambitious goals below the limits suggested by the health authorities.
Nowadays, the use of wood-fired ovens during dry and cold periods of the winter are mostly responsible for breaches of the daily air quality limits. You can find the detailed facts and figures on air quality in Oslo here.


